As a Rocketspark designer, you build websites your clients rely on. You’ve built them a stunning website—now help them see the results. The all-in-one Dashboard makes it simple for them to see what’s happening on their site.
View the full launch blog to get the detailed run-down of everything you can do with the new all-in-one Dashboard. This blog post is a deeper dive into some extra bits that can help designers.
Show clients the value of their website
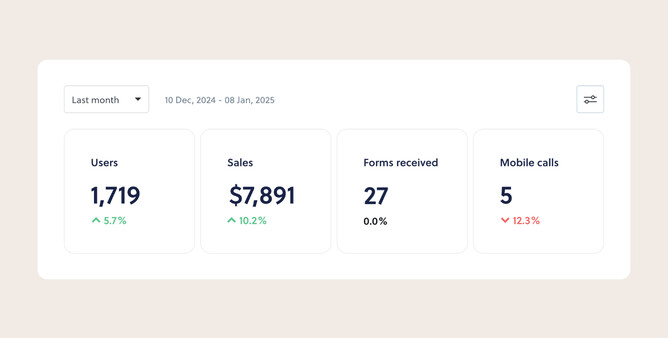
With features like mobile call tracking and forms tracking on Dashboard Plus, your clients can clearly see how their website is driving business. Whether it’s a tradie seeing job enquiries roll in or a florist tracking online sales, the Dashboard gives them tangible proof that their website is working hard for them.
Track the value of your design work
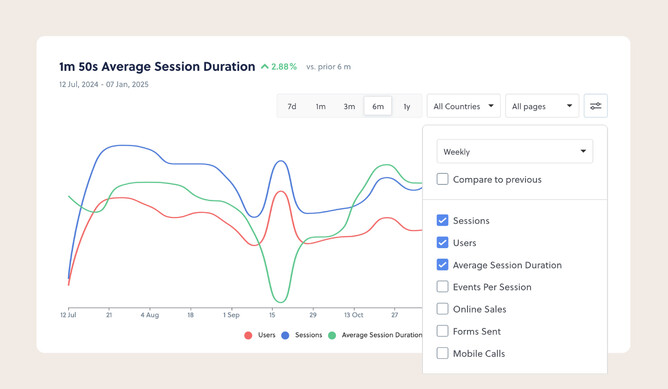
Ever wondered if that redesign or layout tweak made a real difference? With the all-in-one Dashboard, you can track how visitors interact with your client’s website using engagement metrics like:
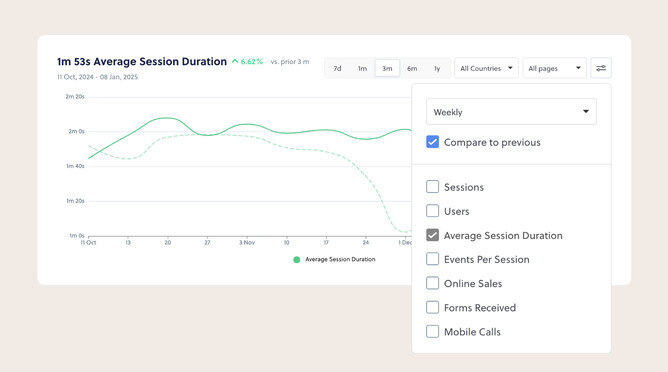
Average session duration: See if visitors are spending more time exploring the site.
Events per session: Measure how many meaningful actions (like clicks or interactions) each visitor takes.
Conversion stats: Know if this increased engagement is turning into enquiries, calls or sales.
These metrics give you clear proof of how your design decisions are impacting the way people use the site. It’s not just about looking good—it’s about making sure the website works hard for your clients and their customers. If the client had Google Analytics before coming to you, they can see a step change on their dashboard.
Tailored insights for their industry
Help your clients focus on the numbers that matter most. Whether it’s local traffic filtering for a daycare or page performance for a builder showcasing their portfolio, the Dashboard adapts to suit their unique needs. As their designer, you can help them get only what they need.
Get the big picture of ecommerce sales
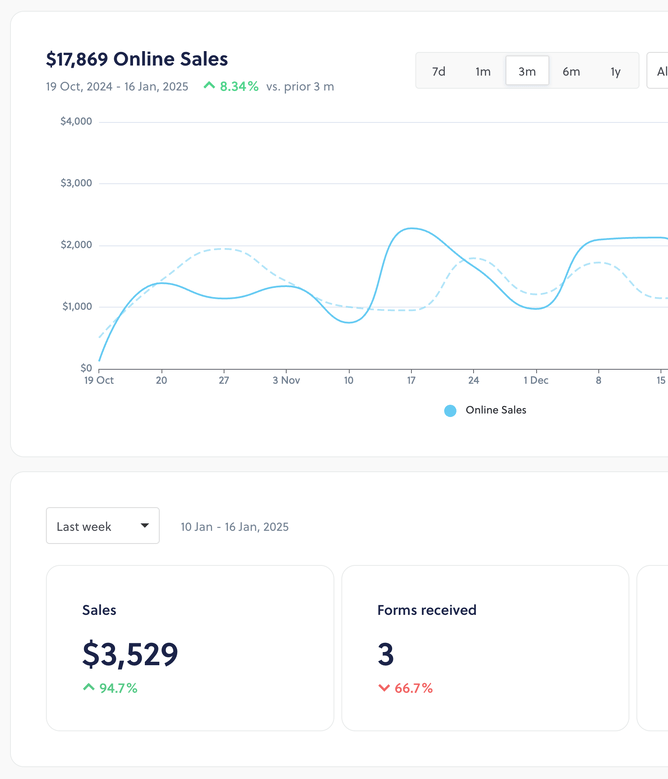
With Dashboard Plus, clients on Ecommerce Grow and Ecommerce Pro will be able to view ecommerce sales revenue on the new Dashboard. Whether that’s sales by day over a week/month or month to month over a 1 year time period, they’ll get a much clearer picture of sales performance.
One thing to note with the revenue stats is that these are completed orders and the stats don’t take into account any refunds that might occur. Being able to adjust the graph to exclude refunds is a future feature idea we’re considering.
You can also display Sales revenue as a quick stat widget below the graph so you can see on the fly how this month compares with last month or week on week performance.
Simplifying post-launch support
You’ve built them a beautiful website—now let the Dashboard handle the heavy lifting on performance insights. With its intuitive layout and easy-to-read stats, your clients will feel confident navigating it themselves. And because it remembers their settings, they can always pick up where they left off.
Future idea—email updates
If your clients aren’t logging into their website regularly, they might be unaware of what’s happening on their Dashboard. In 2025 we’re wanting to bring in automatic email updates so a summary of the key stats arrive in clients inbox on a regular cadence.
Positioning you as their trusted expert
By walking your clients through the Dashboard’s features, you’re not just handing over a website—you’re giving them the tools to understand its impact. This positions you as a trusted partner who cares about their ongoing success, not just the launch.
The all-in-one Dashboard is a win for you and your clients. It showcases the value of your work, keeps them engaged with their website, and strengthens your ongoing partnership.
When should I recommend Dashboard Plus?
Dashboard Basic gives the client 30 days of session data but no other metrics or filters. To get Dashboard Plus with all of the additional metrics and filters, they’ll need to upgrade to Website Builder Pro, Website Builder Pro+, Ecommerce Grow or Ecommerce Pro.
If your client is results-driven, Dashboard Plus gives a much clearer picture—whether they’re an online store, taking leads via forms or receiving phone calls.
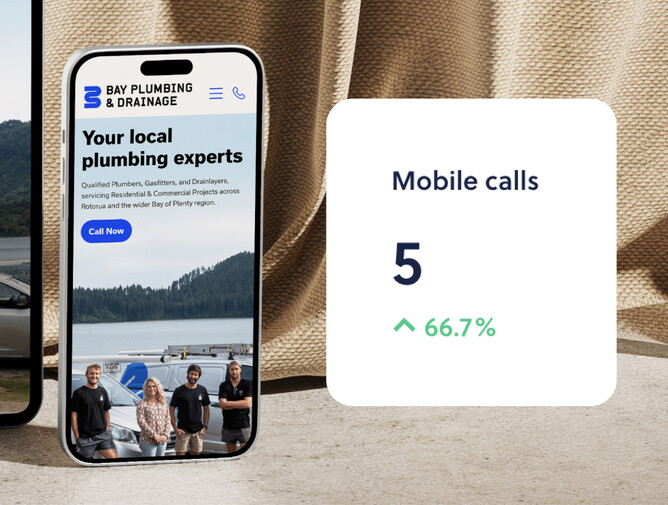
If phone calls are the primary way your client gets enquiries, they haven’t had visibility of how many of those calls came as a result of the website. Now with mobile call tracking on Dashboard Plus, they’ll understand that some of the calls they’re getting are actually fuelled by the website—showing proven value in the website you’ve delivered. Likewise if form enquiries is a key source of business, you can see how these increase over time.
For customers on Ecommerce Lite, they’re missing out on ecommerce sales reporting unless they manually export order information. Dashboard Plus (on Ecommerce Grow and Ecommerce Pro) gives online stores the ability to graph sales revenue over as long a period as 1 year (with comparison with previous period). This will really help them with forecasting and visualising performance month on month.
If a client is struggling to meet the cost of the Website Builder Plan or they’re just starting out and might take some time to start generating leads on their website, you could suggest that Website Builder Pro is something they might look at in 3-6 months time.
If my client upgrades to get Dashboard Plus, will the Dashboard Plus metrics only start tracking from the point they upgrade?
We started tracking volume of mobile call taps and form completions (when someone taps the phone icon on a mobile website) in early December 2024 for all websites, so if your client has been with Rocketspark since then, they’ll have a few months of data there.
We track mobile call, form and ecommerce sales volumes even if someone doesn’t have access to Dashboard Plus, so if they do upgrade to a higher plan they’ll have this history revealed once they upgrade.
The information that comes from Google Analytics (users, sessions, average session duration and events per session) will go back as far as data exists in your Google Analytics account.
How do I set it up for clients?
If your client doesn’t have a Google Analytics profile, they’ll need to create one there first. Once they have a Google Analytics profile (or if they already have one), they can connect with Google Analytics from their Dashboard. If you have access to the client’s Google Analytics you can connect the Dashboard graph for them.
