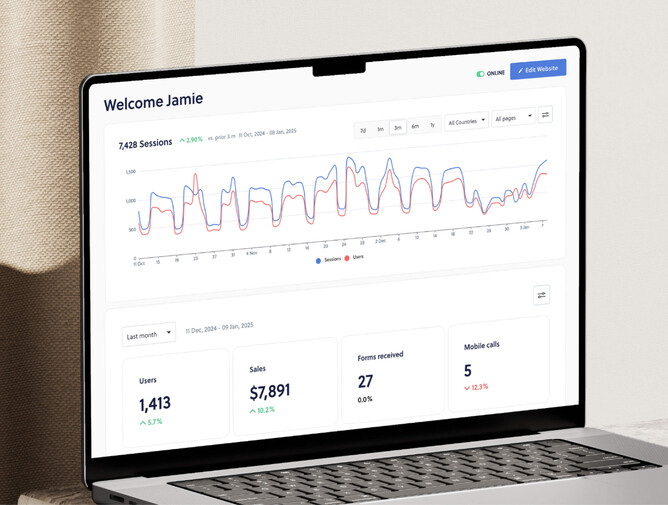
See exactly how your website is doing, all in one spot. With the all-new Dashboard, you’ll have everything you need to keep your finger on the pulse. No complicated charts, just clear, easy-to-understand numbers.
Made for everyday business owners, not marketing gurus
Other tools are made for marketing gurus, but this Dashboard is the easiest website stats you’ll find anywhere. When we designed the all-new Dashboard, we imagined a busy tradie or hairdresser catching up on admin after a long day on the job, asking “is my website even doing anything?”.
We cherry-picked the most useful website performance stats and made them easy to find—right at a glance. Need the basics? Done. Want to dive deeper? Easy. The Dashboard adapts to what you need.
Dashboard—the heartbeat of your website
Your website’s graph isn’t just numbers—it’s a real-time story of how your site is performing. Dive into these powerful tools to track your success:
The magic of call tracking
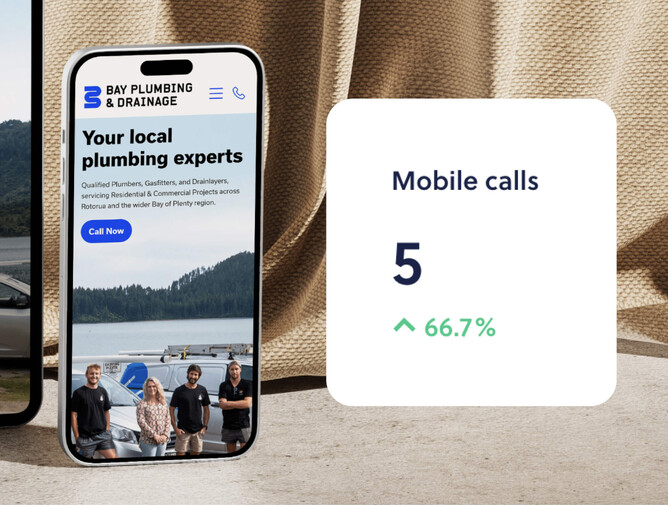
Ever wondered how many calls come from your website? With mobile call tracking, the Dashboard logs every tap on your phone number when someone visits your website on their smartphone. Whether it’s a quiet month or the phones are ringing off the hook, you’ll see it all in your Dashboard.
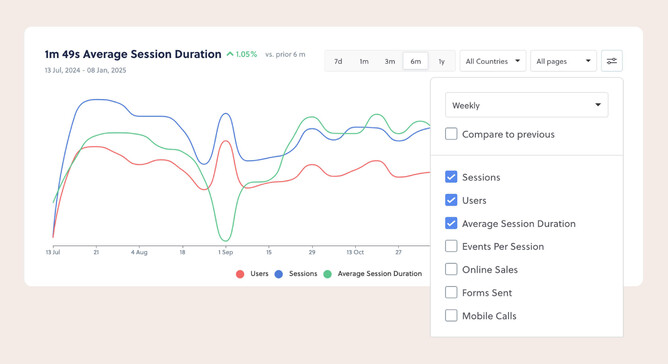
Overlay different stats on the same graph
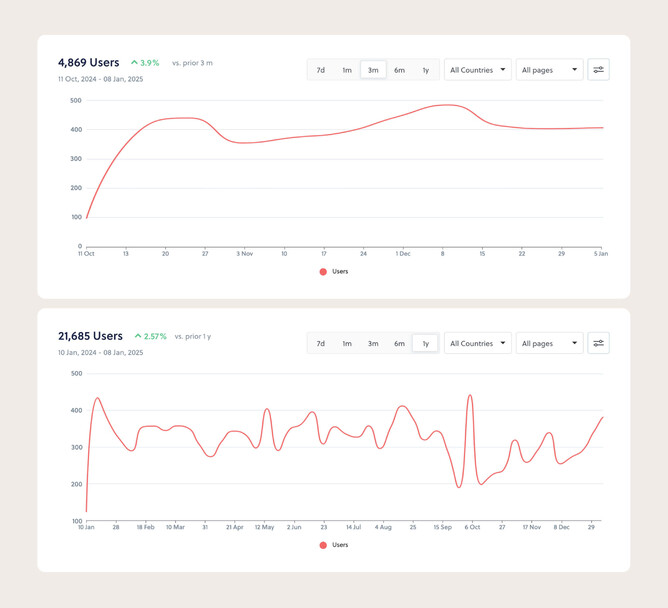
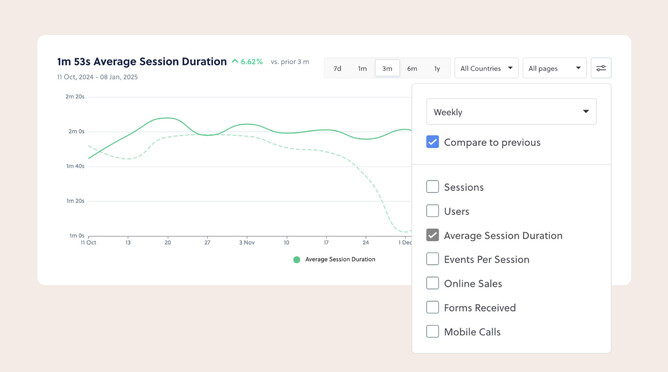
With the Dashboard, you can overlay metrics like sessions, users, average session duration, events per session, mobile calls, sales, and form submissions all on the same graph. Want to see if a bump in visitors led to more calls? Done. Curious if people spend more time on a page after some design changes? Easy.
Zoom in or out with different timescales
Some weeks you want the big picture; other times, you need the nitty-gritty. With timescale adjustment, it’s your call. Zoom out to spot long-term trends or zoom in to see what’s been happening this week. Whether you’re comparing month-to-month or digging into daily spikes, you’re the one in the driver’s seat.
Go global—or keep it local
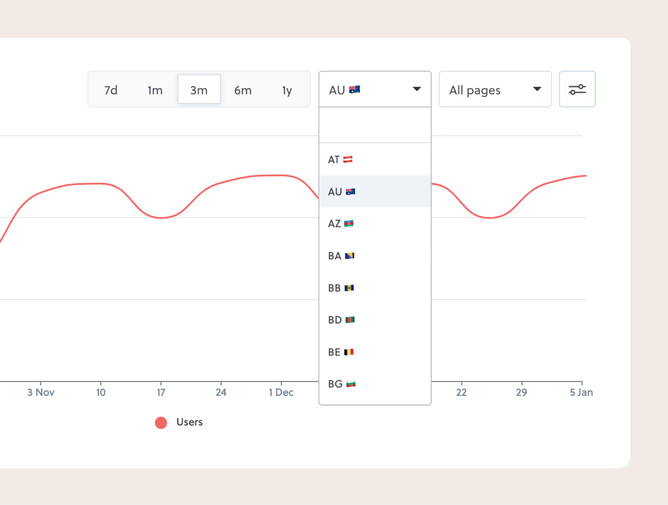
Country filtering lets you see where your visitors are coming from—across the globe or just down the road. If you’re a local business, filter to your country and get straight to the stats that matter to you. Or, if you’re growing internationally, see how your audience shapes up across different regions.
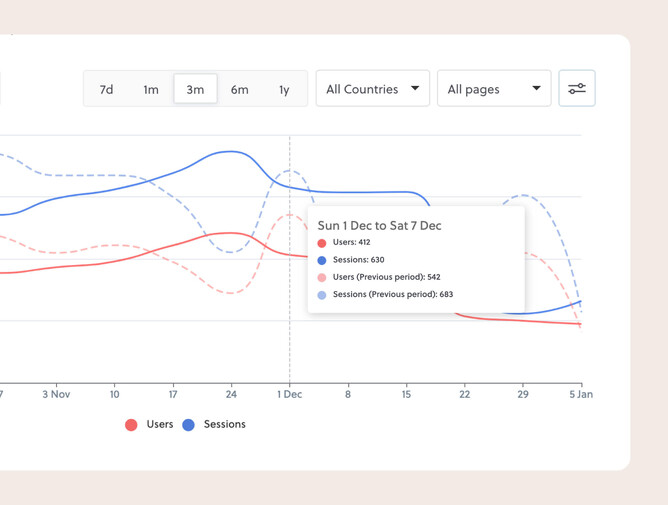
Compare periods to keep track of progress
Are you crushing it compared to last month—or is there room to lift your game? With the compare feature, you can stack this period’s data against the past and see how you’re tracking. Whether it’s a quiet week or a new high score, you’ll know exactly where you stand.
See how specific pages are working
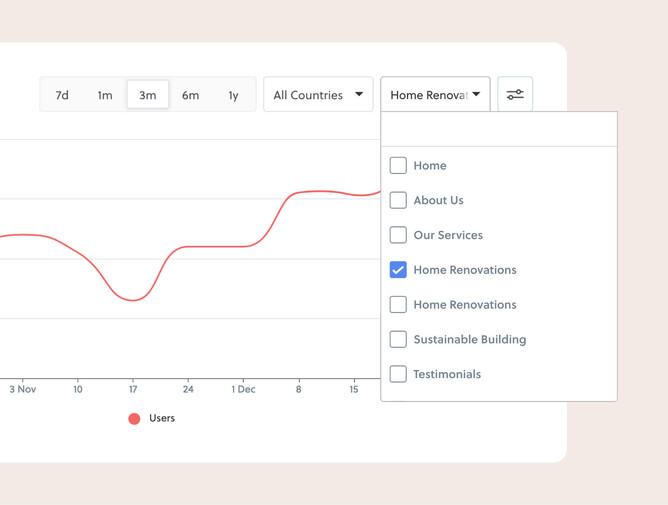
Not all pages are created equal, right? With page filtering, you can find out exactly how each page is performing. Is your homepage smashing it? Is that blog post you forgot about suddenly pulling in traffic? Focus on the pages that are working hard for you—and give a little love to the ones that need it.
Quick stats—your website at a glance
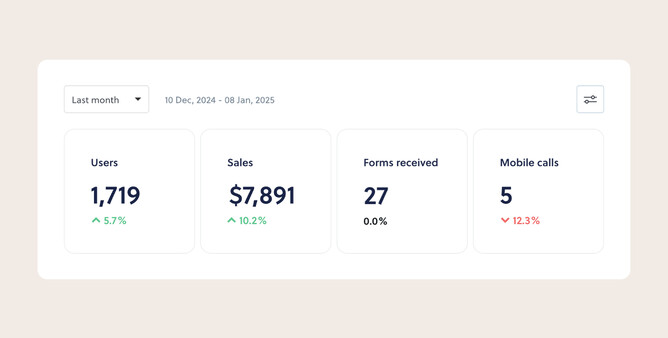
Right below the graph, Quick Stats give you the essentials without the fuss. See how many users visited, mobile calls were made, forms were sent, or sales came through—all in one spot. You can choose which Quick Stats you want to show on your dashboard, so you’ll only see the ones that matter to you.
Think of them as your website’s daily report card, showing exactly what’s happening without needing to dig through graphs. Simple, clear, and ready when you are.
Google Analytics reimagined—Rocketspark style
We did our homework with SEO and digital marketing experts and they made it clear we should get our data from Google Analytics. But Google Analytics is way too techie for the average business owner. We’ve pulled in all that Google Analytics data and repackaged it with Rocketspark’s best-in-class ease of use.
Plus, we’ve totally redesigned the connection process so getting plugged in with Google Analytics is easy as pie. If you want the next level of detail that Google Analytics provides you can still head over there to get the nitty gritty details.
Your Dashboard, your way
The all-new Dashboard remembers your settings, so it’s always just how you like it. Whether you’ve filtered for a specific page, adjusted your timescale, or customised your graph, your Dashboard stays ready for you to pick up where you left off. It’s one less thing to think about—and more time saved for what matters most.
Tailored to your industry—stats that matter most
No two businesses are the same, so why settle for one-size-fits-all data? The Dashboard can be customised to show what’s most important to you, no matter your industry. Here are some examples of how you can make it work for your business:
For building & trades
As a builder, leads and enquiries are everything. Your Dashboard can prioritise:
Mobile call tracking to see how many potential clients are reaching out directly from your website.
Form submissions to track job requests or quote enquiries.
Page performance to check how well your services page or portfolio is attracting interest.
For education
For daycare centres, building trust and receiving enquiries is key. Your Dashboard might highlight:
Form submissions to see how many parents are enquiring about spots for their children.
Mobile call tracking to keep tabs on phone enquiries sparked by your website.
Page performance to track engagement with pages like “About Us” or your gallery showcasing facilities.
For professional services
Bookkeepers rely on building trust with small businesses. Your Dashboard can focus on:
Mobile call tracking to understand how many potential clients are reaching out for consultations.
Visitor trends to gauge if your marketing efforts are driving traffic to your site.
Compare periods to check if tax season campaigns are boosting visits and enquiries.
For online stores
Florists need to know if their online presence is blooming. Your Dashboard could focus on:
Online sales metrics to track how many bouquets or gifts are flying out the door.
Visitor trends to understand when people are browsing, whether for weddings, events, or last-minute surprises.
Local traffic filtering to see if your website is capturing your local audience.
Whatever your business, the all-in-one Dashboard can be set up to match your needs. Filter the data that matters, leave out the noise, and always see what’s most relevant to you.
See where your SEO stands at a glance
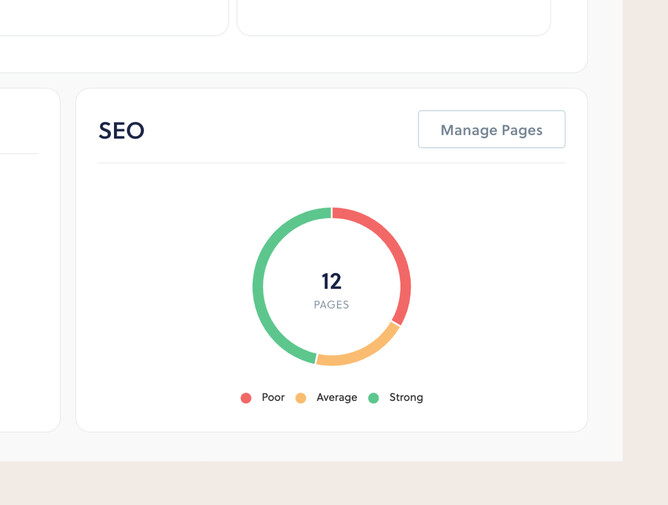
Your website’s SEO scores don’t have to be a mystery. The Dashboard shows how each page stacks up—from the stars to the strugglers. Strong pages? Keep them shining. The ones falling behind? They’re flagged, so you know exactly where to focus. It’s like a cheat sheet for getting found online.
See what’s available on each plan
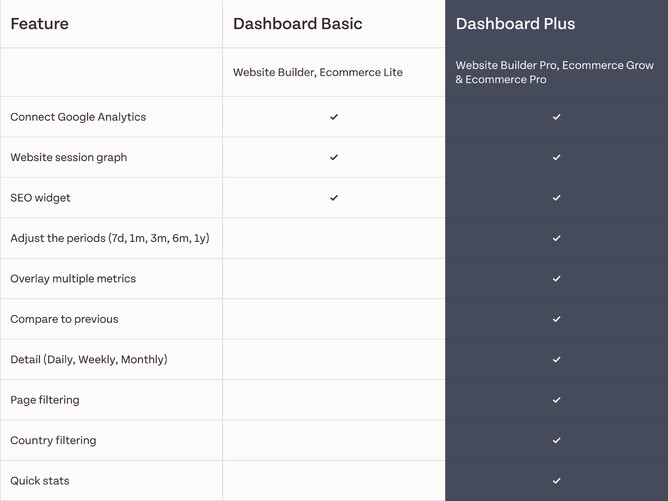
On the Website Builder and Ecommerce Lite plans, you’ll get website session reporting for the last 30 days with comparisons to the previous month.
To unlock features like mobile call tracking, timescales, and filters, upgrade to Website Builder Pro, Website Builder Pro+, Ecommerce Grow, or Ecommerce Pro.
View our help guides to learn more
How to create a new Google Analytics Account and connect to your website
How to connect an existing Google Analytics Account to your website dashboard
How to understand your Google Analytics Graph and data on Rocketspark
How to disconnect or connect to a new Google Analytics graph on your website
What does the SEO circle pie graph mean on my dashboard?
